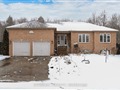
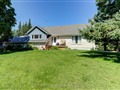
23 Lynch Lane
$913,762
Comparative Market Analysis
Jul 1, 2025
NOT AN ACTIVE LISTING
Historical Performance
| Period | $ Change | % Change |
| 1 Day | +$311 | +0.034% |
| 7 Days | +$266 | +0.029% |
| 30 Days | -$1,635 | -0.179% |
| 3 Months | -$3,626 | -0.395% |
| 6 Months | +$12.2k | +1.35% |
| 1 Year | -$48.2k | -5.01% |
| 3 Years | +$153k | +20.1% |
| 5 Years | +$245k | +36.6% |
| 10 Years | +$498k | +120% |
List My Property
Real Estate Statistics
Financing Solutions
Browsing History
1 Harry Parker Pl, Adjala-Tosorontio
4 seconds ago
AS SEEN ON


Are You a Licensed Real Estate Agent or Broker?