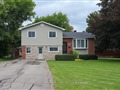
3 Simon Dr
$839,187
Comparative Market Analysis
Apr 29, 2024
NOT AN ACTIVE LISTING
Historical Performance
| Period | $ Change | % Change |
| 1 Day | +$257 | +0.031% |
| 7 Days | +$149 | +0.018% |
| 30 Days | -$1,690 | -0.201% |
| 3 Months | -$3,461 | -0.411% |
| 6 Months | +$8,876 | +1.07% |
| 1 Year | -$53.2k | -5.96% |
| 3 Years | +$147k | +21.3% |
| 5 Years | +$222k | +36.0% |
| 10 Years | +$398k | +90.2% |
List My Property
Real Estate Statistics
Financing Solutions
AS SEEN ON


Are You a Licensed Real Estate Agent or Broker?